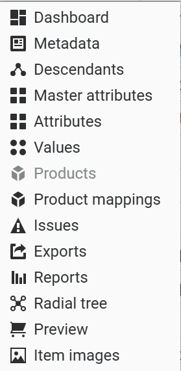
Each category has the following standard view, which can be accessed by opening a category:
This is the multi-page printable view of this section. Click here to print.
Each category has the following standard view, which can be accessed by opening a category:
In its default state, the dashboard displays basic statistics about a category or branch.
It can be customized to include data quality rules, before and after summaries, and other project-specific summary information.
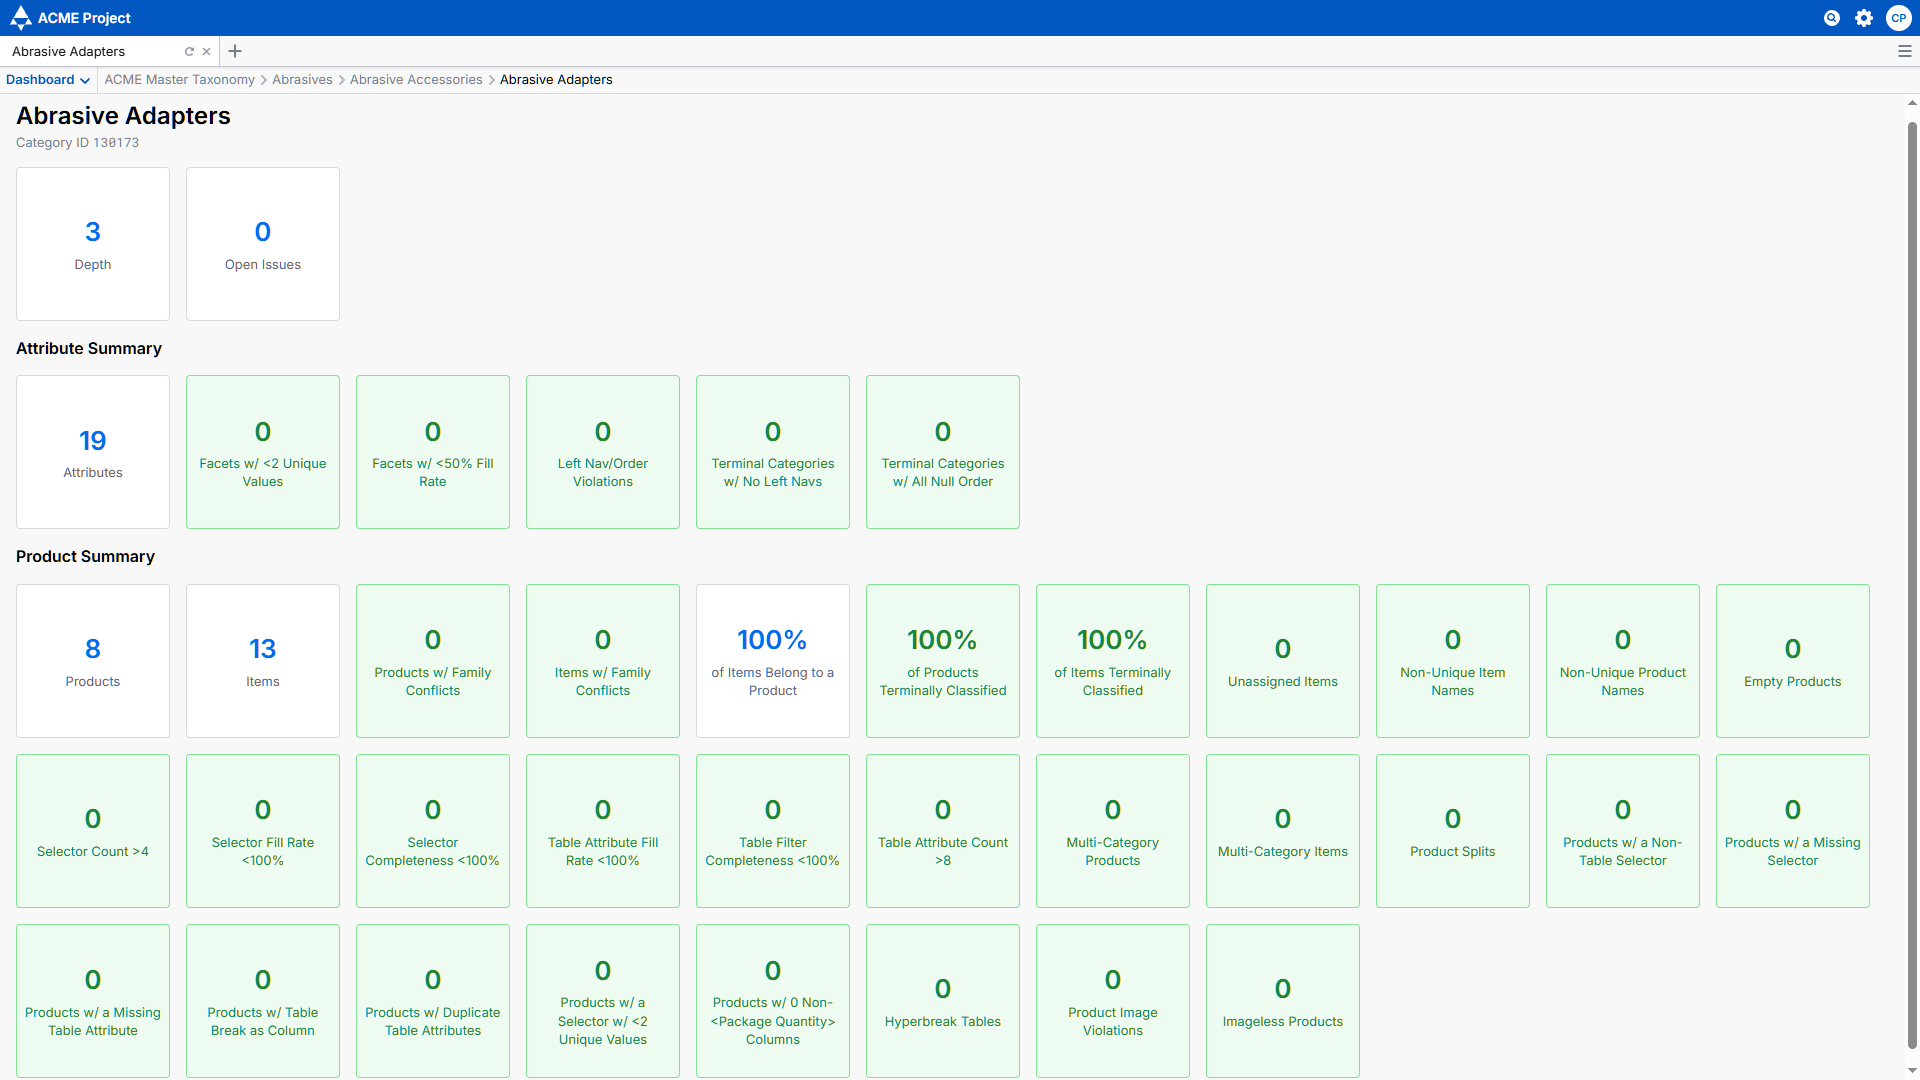
The SkuDB dashboard can be customized with any set of analyses, tailored to a given project. The image above shows an example set of customized metrics, with many slices of the data available at a glance. All aspects can be customized upon request, including both style and content.
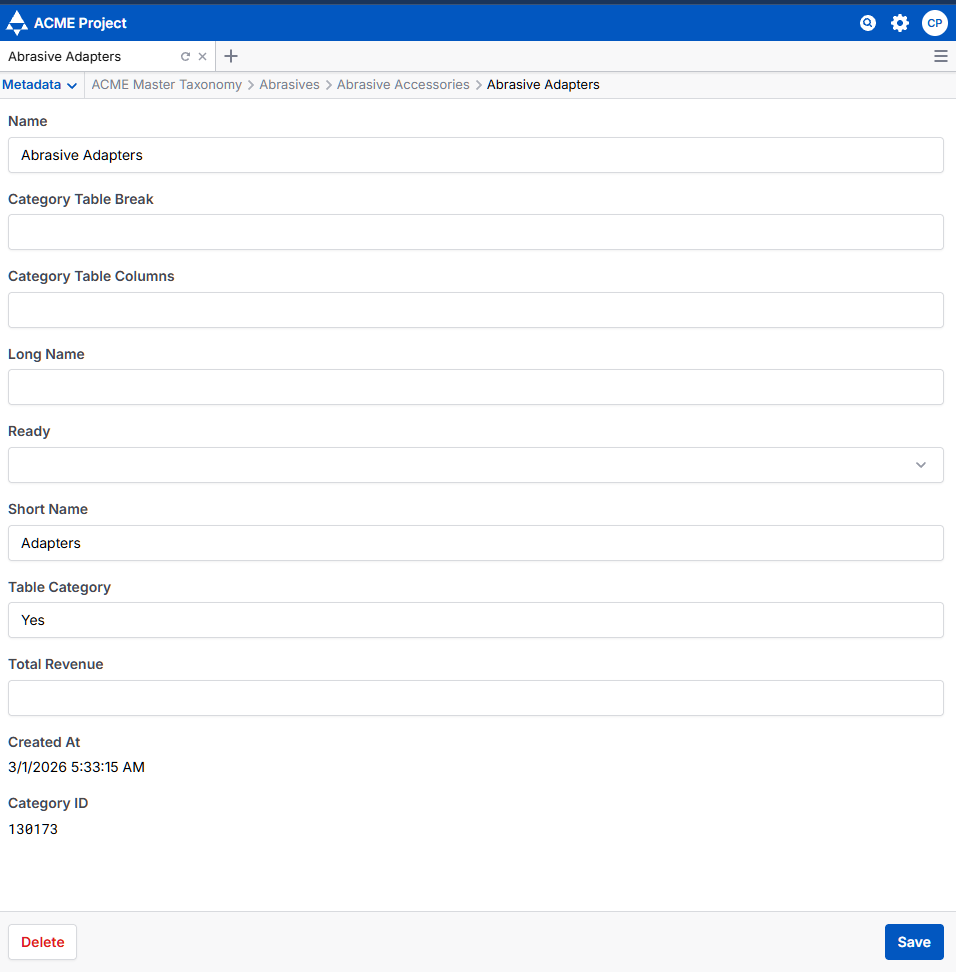
The category metadata view allows users to update the metadata attached to a given category, without leaving the category tab. An unlimited number of metadata can be tracked here. For more information on adding new metadata fields, see Fields.
The Descendants tab contains a spreadsheet view of all the child categories of the selected category, with columns for standard or user defined fields including category name, category path, description, child counts, category level, variant type, category ID, and a creation timestamp.
A drop-down menu provides the following functionality:
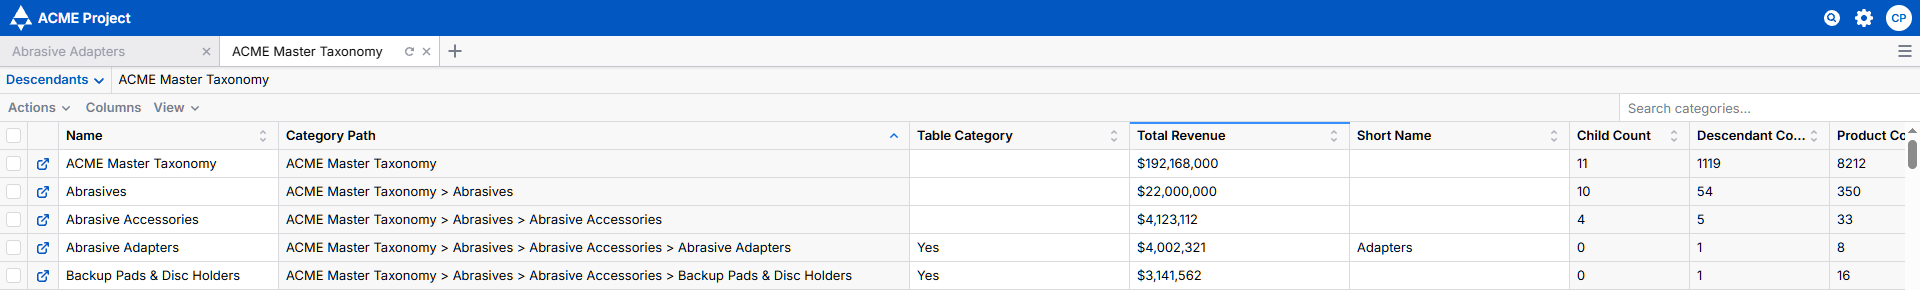
The Descendants view contains the same fields as displayed in the Metadata view, as well as standard columns like Child Count and Item Count to allow for common use-cases out of the box.
The Attributes tab contains a spreadsheet view of all the attributes in the category, with columns for standard or user defined metadata fields including attribute name, attribute ID, breadcrumb, units of measure, allowed values, data type, display type, rank, required, sample values, and a creation timestamp.
A dropdown menu provides the following functionality:
The Values tab contains a spreadsheet view of all unique values in the category, with columns for standard or user defined metadata fields including attribute name, value, ID, breadcrumb, units of measure, and a creation timestamp.
A dropdown menu provides the following functionality:
The Items tab contains a spreadsheet view of all the items and/or products in the category, with columns for standard or user defined metadata fields including Item ID, and a creation timestamp. The default item tier names can be updated in the project’s Item Tiers Settings.
The Items tab features icons at the far left for “card view” and “image view” and can be customized to contain quick links to other content as needed (e.g., source url, data sheet)
A dropdown menu provides the following functionality:
The Issues tab contains a spreadsheet view of all the issues opened in the selected category, with columns for standard and user-defined metadata fields (e.g., issue name, status, author, description, priority).
By selecting “Edit Issue View,” the icon in the second column of the issue log’s spreadsheet view, users can bring up a popup view of all fields related to the issue. This can be helpful in issue review or editing.
There are also dropdown menus for creating and deleting issues, controlling pagination, toggling on/off columns & other configuration options.
The Exports tab offers data export originating in the selected category. If exports are required from the entire hierarchy, open Exports from the Root category. Exports display a progress metric and have a cancel button.
SkuDB’s standard exports include:
Reports provide a way of visualizing statistical information about the data contained in the SkuDB instance. Reports give information on categories and items through a variety of metrics that are useful for QA, descriptive summaries and as design aids.
Reports are typically filterable to include terminal categories, or categories only on certain levels.
Reports can often be toggled between a graphical display and a table of information. Additionally, the scale can typically be adjusted between linear and logarithmic. Standard reports include:
![An image of a radial tree view, displaying each category under the [Abrasives] L1 as a dot orbiting a central point, representing the parent category. Categories with higher product counts are displayed in red, while lower counts display green. Categories between the min and max threshold appear more green, yellow, or red depending on product count.](/category-views/radial-tree/radial-tree-new_hu_8e21c842671af6e8.png)
The Radial Tree view provides a radial graph of the hierarchy structure from the selected category and down. This is an adjustable graphical representation of the hierarchy that is useful for QA, descriptive summaries, and as a design aid. The radial graph is adjustable on the following parameters: Label Size, Orbit Radius, Category Radius, Extent, and Rotation. There are also buttons to Reset Controls and Toggle Fullscreen.
The Preview mode simulates a web navigation experience based on the current state of the selected category and its children. Categories appear as if laid out on a webpage, with a search bar across the top, followed by category tiles, and with a listing of items and a navigation filter below. Preview is a useful mockup of the hierarchy design. It can also be valuable as a classification aid.
While SkuDB comes equipped with a default Preview Mode UI mirroring the typical features of a modern ecommerce experience, it can also be customized to mirror the expected display of category and product landing pages.